

Full transparency over every vehicle's condition.
Corporate fleets and leasing companies know at any time what happened to each vehicle – during use, at hand-over and at the end of the contract.
Benefits for fleets and lessors.
Full accountability
Every damage is linked to time, place and driver – no more damage that surfaces weeks later without a cause.
Fewer damages
Instant feedback to drivers makes them more careful – damage frequency goes down across the fleet – see what this means for your fleet ↓
Fair returns, higher residual values
A complete digital damage history makes end-of-lease assessments transparent and supports remarketing.
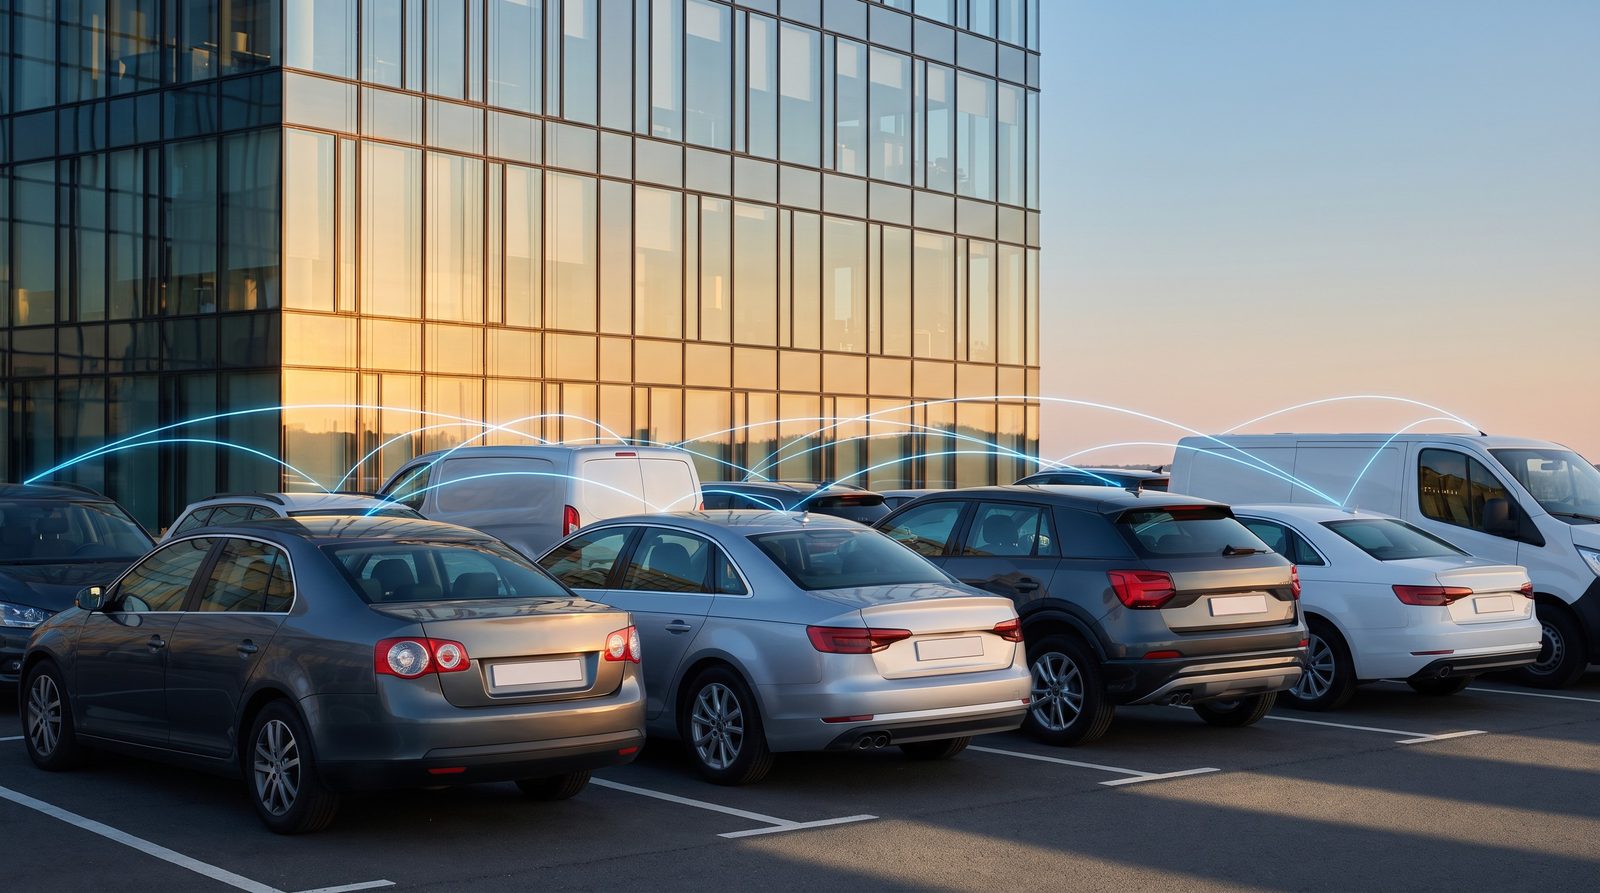
Transparency that pays off.
When every incident is noticed and linked to the driver, drivers become more careful – damage frequency goes down.
Every damage costs money – through repairs or loss in value at the end of the contract. Even 15% fewer damages make a considerable difference – the example calculation shows what this means for your fleet.
Your fleet
Based on our experience: 15% fewer damages through feedback to drivers
120 fewer damages per year in your fleet (of 800)
Effects based on carvaloo customer data. Damage recovered from drivers or lessees and higher remarketing values not included. Example calculation – not a quote. We calculate your business case with your fleet data.
Fully automated from damage to claim.
Four AI building blocks turn every damage event into a complete damage report.
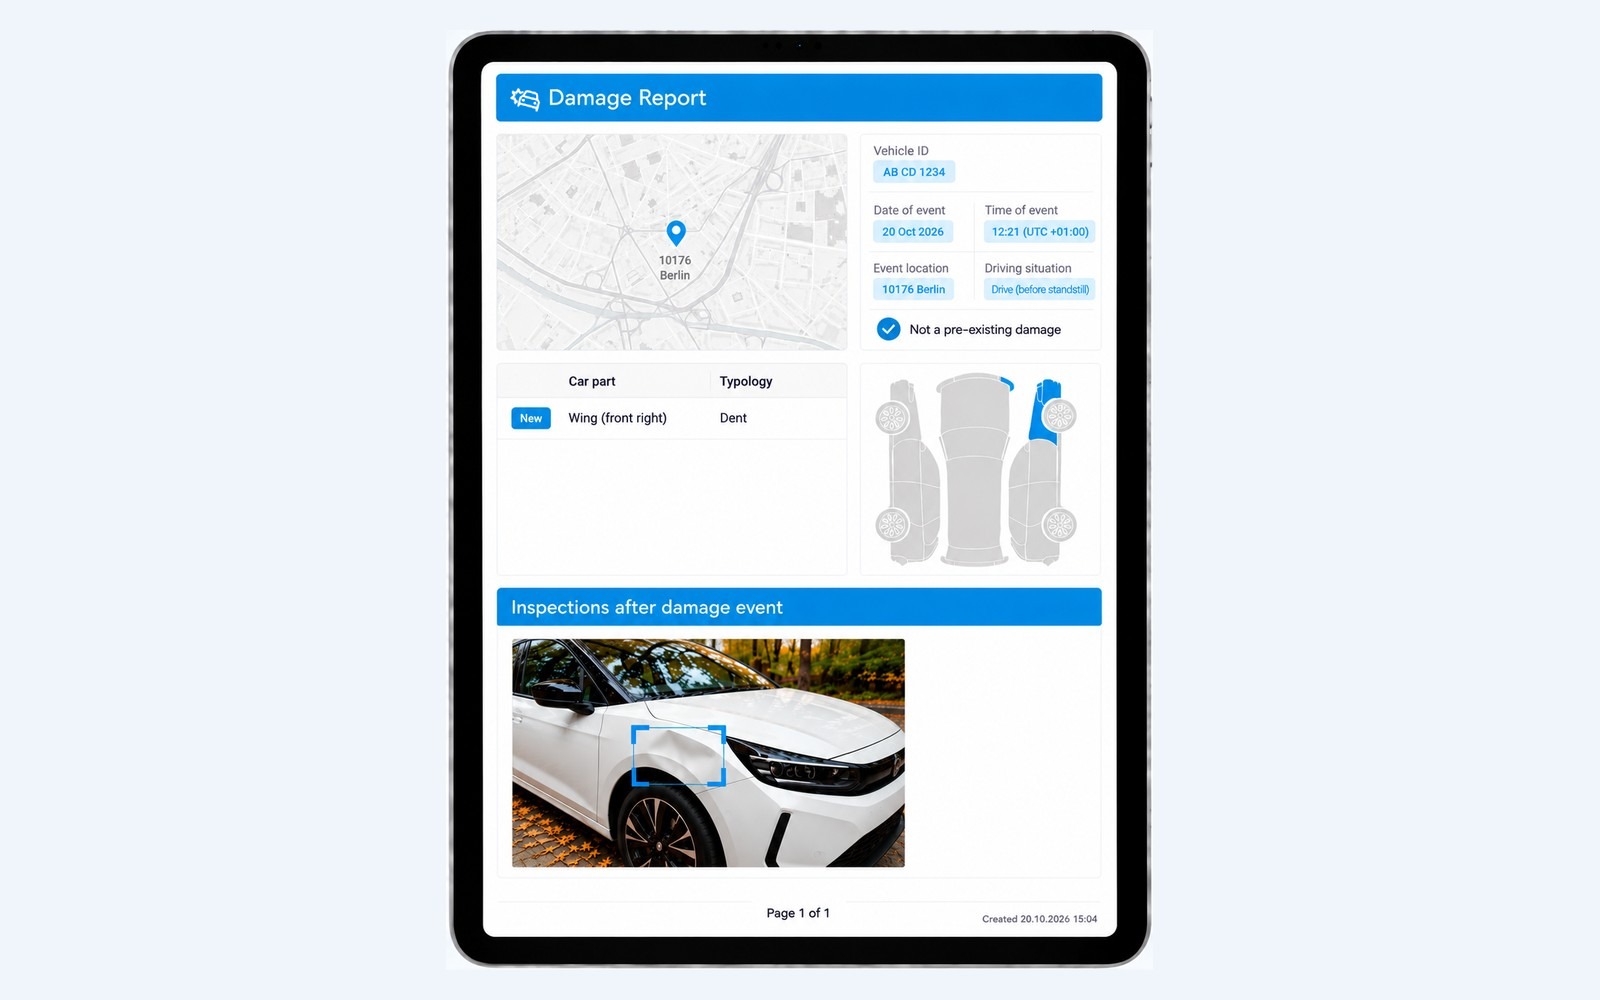
Complete damage report
- How did it happen?
- Where did it happen?
- When did it happen?
- In which driving situation?
- Which damage is new?
- How large is it?
- Which type – dent, scratch …?
- Which car parts are affected?
Delivered in the carvaloo WebApp or via API.
More than damage detection.
Even more services to protect your assets – on the same platform, no extra hardware.
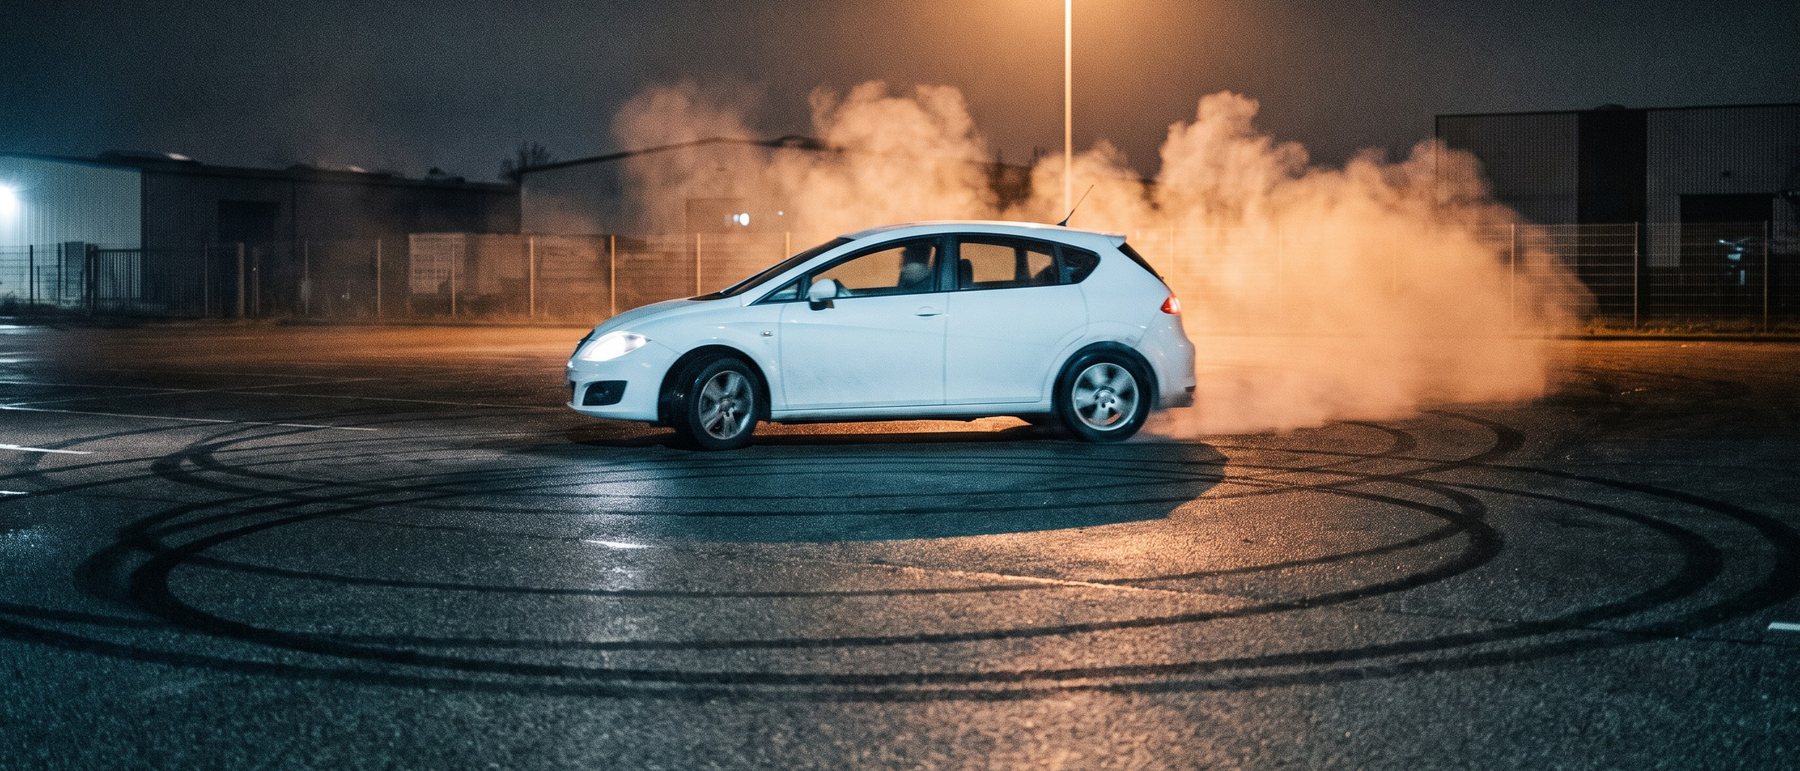
Risk, not thresholds.
Most driving analyses flag harsh braking and cornering above fixed limits – yet these say little about the actual damage risk. carvaloo's AI has correlated tens of thousands of real damages with the driving that preceded them. It calculates how much a driver's style raises the damage risk compared with average driving – before any damage occurs.
- Per trip: driver and fleet operator are notified of risky trips, with the risk increase in percent
- Per driver: a risk score across all trips – focusing on the riskiest few percent of drivers typically reduces fleet risk significantly
- Your rules: you decide on the consequences, from a warning to excluding a driver after repeated warnings
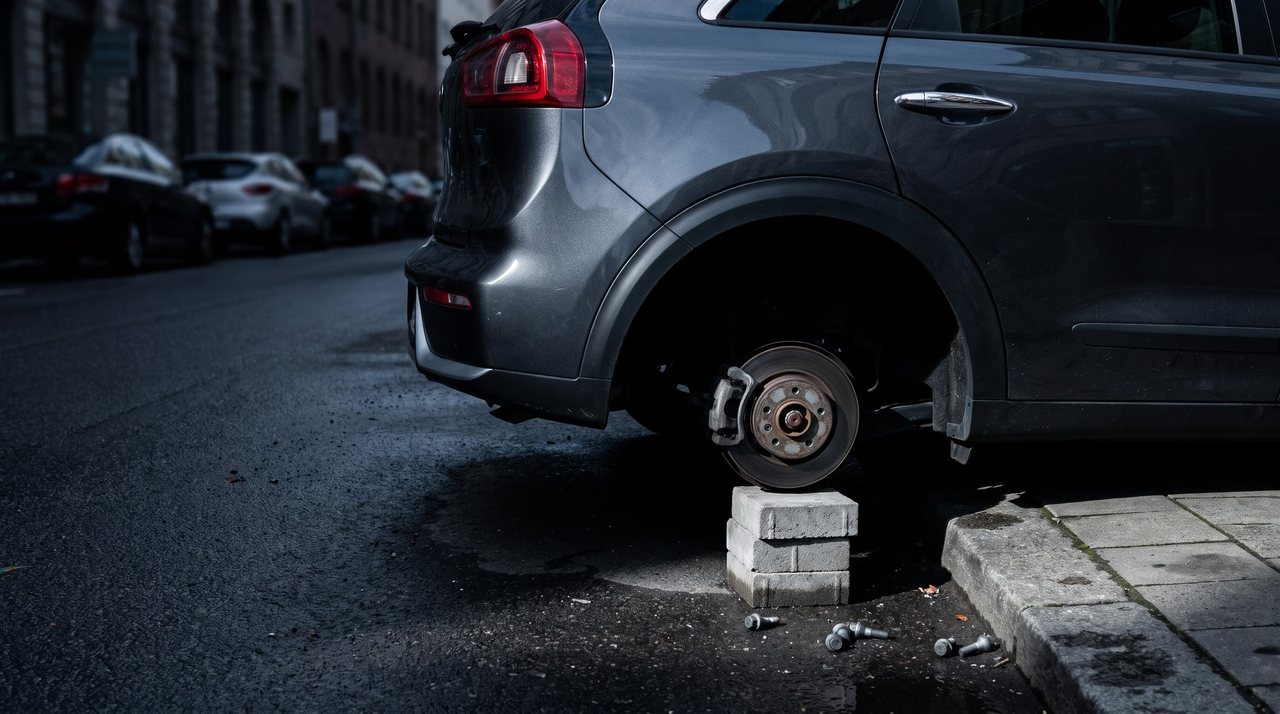
Theft & misuse
Your vehicles report when something is wrong – also while they are parked.
- Rim theft: the AI recognises the characteristic jacking-up of the vehicle
- Use outside a booking or outside agreed service hours
- Late return risk: alert when a vehicle is too far from its return location to make it back on time
- Alerts to your operations team for quick action
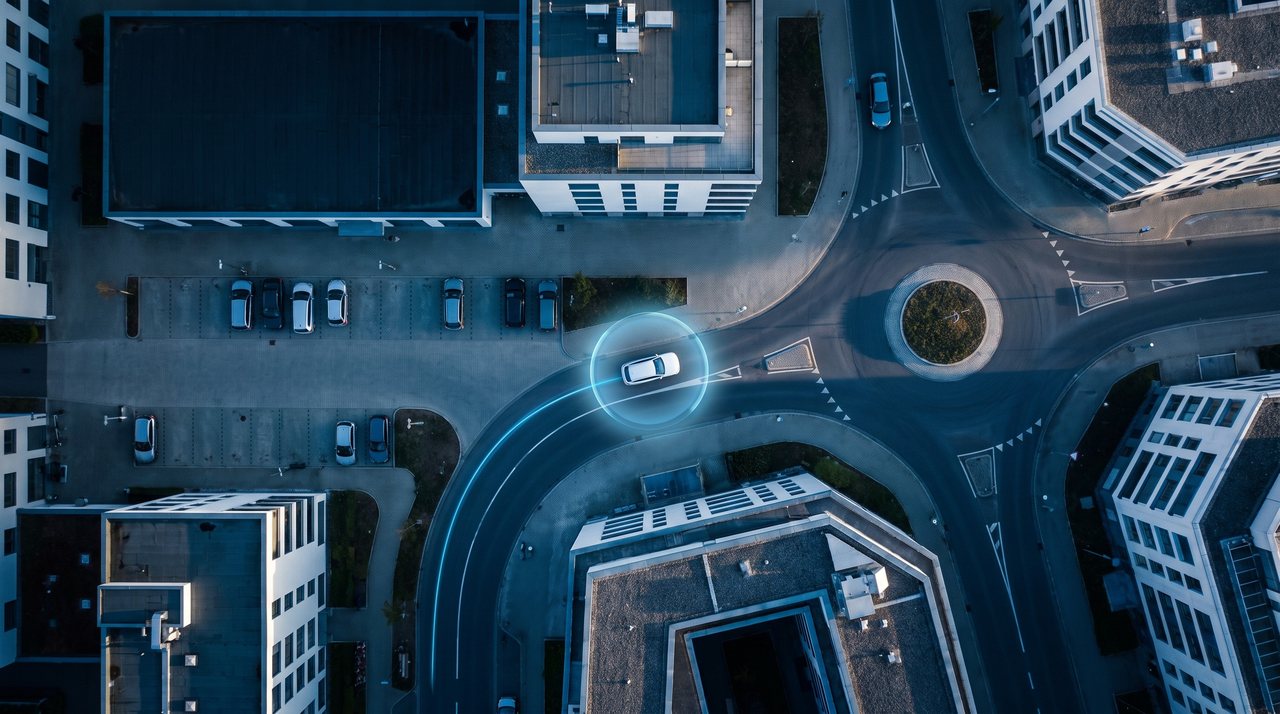
Know where your vehicles are
Classic telematics, included in the same platform – plus smart search tools for your operations team.
- Vehicle tracking: current position, trip history and usage analytics
- Geofencing: zones you define yourself – to detect contract infringements, e.g. use outside permitted areas
- Radius search: find out which vehicles were at a given place at a given time – to quickly resolve hit-and-run accusations and spot misuse hotspots
Know what happens to every vehicle.
Let us calculate your business case with your fleet data.
Get in touch